As part of our mission to advocate for EB-5 investors, AIIA has filed multiple Freedom of Information Act (FOIA) requests for information from USCIS on topics that impact the EB-5 immigrant investor community.
(来自中国的读者们可以通过以下链接访问AIIA微信公众号上发表的本文翻译: https://mp.weixin.qq.com/s/dNTtBs-KeQDRpXHGodKmbg)
Because USCIS does not habitually provide timely response to FOIA requests, AIIA has also initiated litigation against USCIS to compel the agency to respond. We have received, and will continue to receive hundreds of pages worth of documents including internal memos, emails and training manuals. AIIA Members may request a full copy of government responses to AIIA FOIA requests. If you would like to receive the complete dataset, reach out to us through our contact form. AIIA is grateful to Alexandra George of the Galati Law firm for leading the FOIA litigation effort against USCIS in order to obtain this data.
We have previously reported the statistics we received from official data USCIS by filing multiple lawsuits against the government agency. This includes detailed data on I-526 and I-526E receipts from April 2023 and November 2023. USCIS has now provided AIIA with a report through July 31, 2024, with data queried by the USCIS Office of Performance and Quality in September 2024. The updated data contains the distribution of I-526 and I-526E receipts by TEA category and country of chargeability, which is crucial for understanding visa backlog and waiting time estimation in the new reserved visa categories.
The data provided by USCIS to AIIA is the most complete post-RIA I-526E report to date because (1) the report provides receipts by month, which is important for showing trends, and (2) the report provides data that USCIS queried recently, in September 2024. The query date is important, because USCIS takes time to enter receipts into the database. The report that USCIS provided to AIIA captures 7,097 I-526 and I-526E filed April 2022 to July 2024. (By comparison, the FOIA report provided to IIUSA, which reported an earlier query dated July 2024, captured 6,506 receipts for the same period.)
Total number of I-526/I-526E filed between April 1, 2022 to July 31, 2024, by TEA category and country of chargeability (latest stats as per USCIS data queried September 2024 in response to AIIA FOIA request)
| China | India | Rest of World | Total | % Total | |
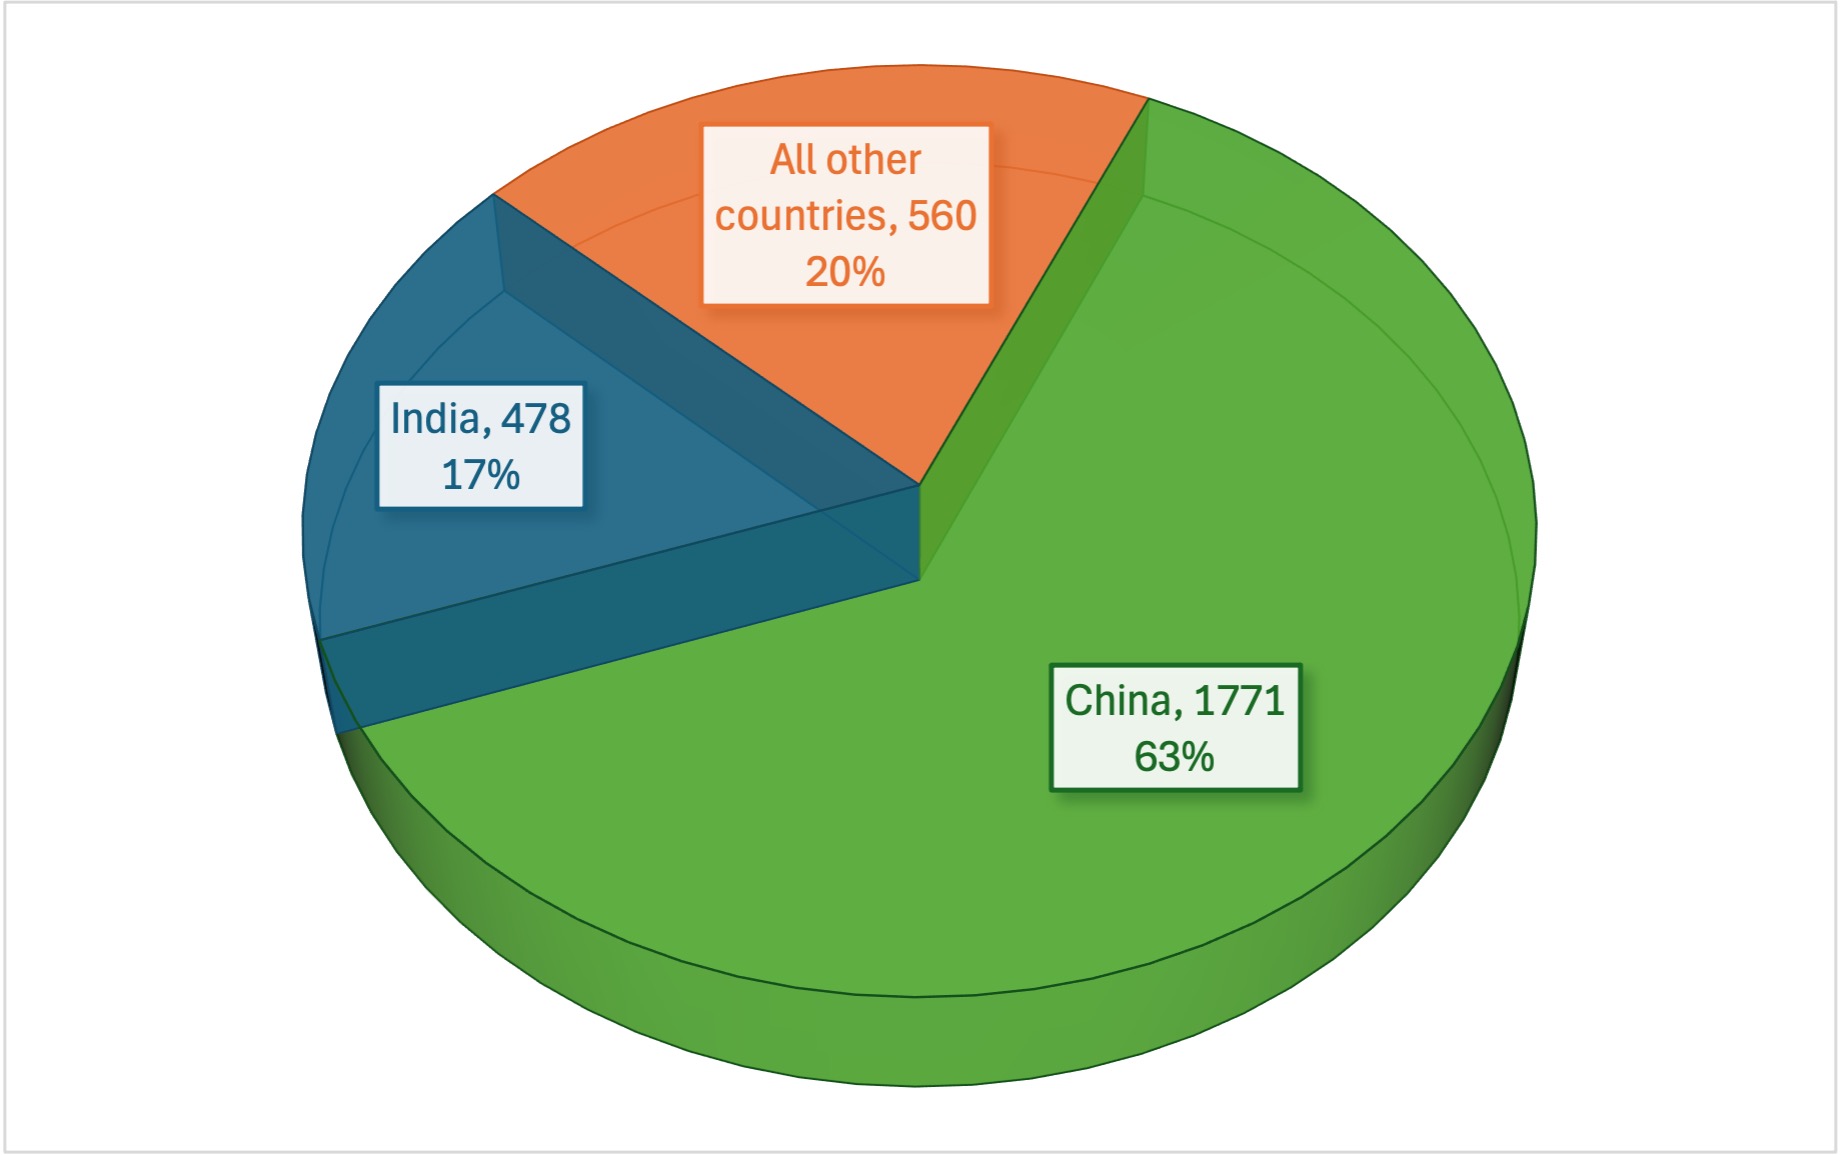
| Rural | 1,771 | 478 | 560 | 2,809 | 40% |
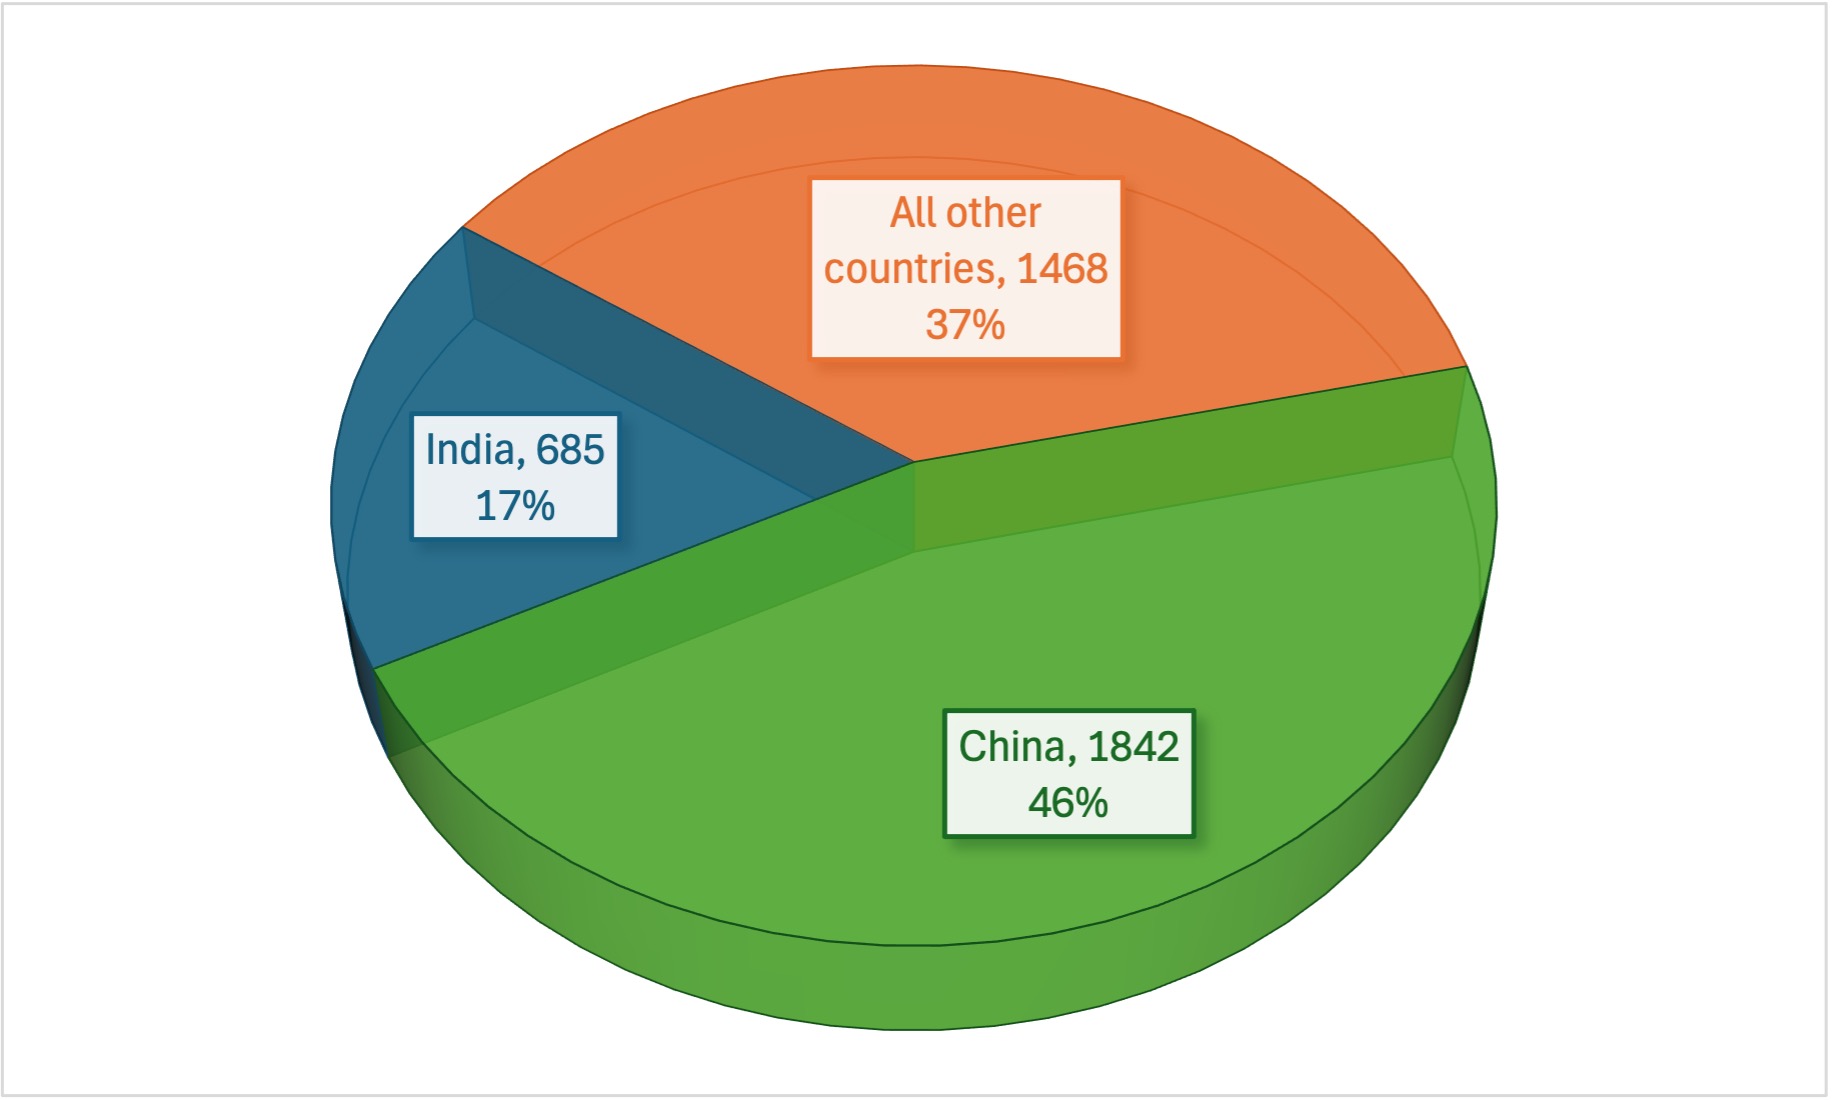
| High Unemployment | 1,842 | 685 | 1,468 | 3,995 | 56% |
| Infrastructure | 0% | ||||
| Other | 77 | 53 | 163 | 293 | 4% |
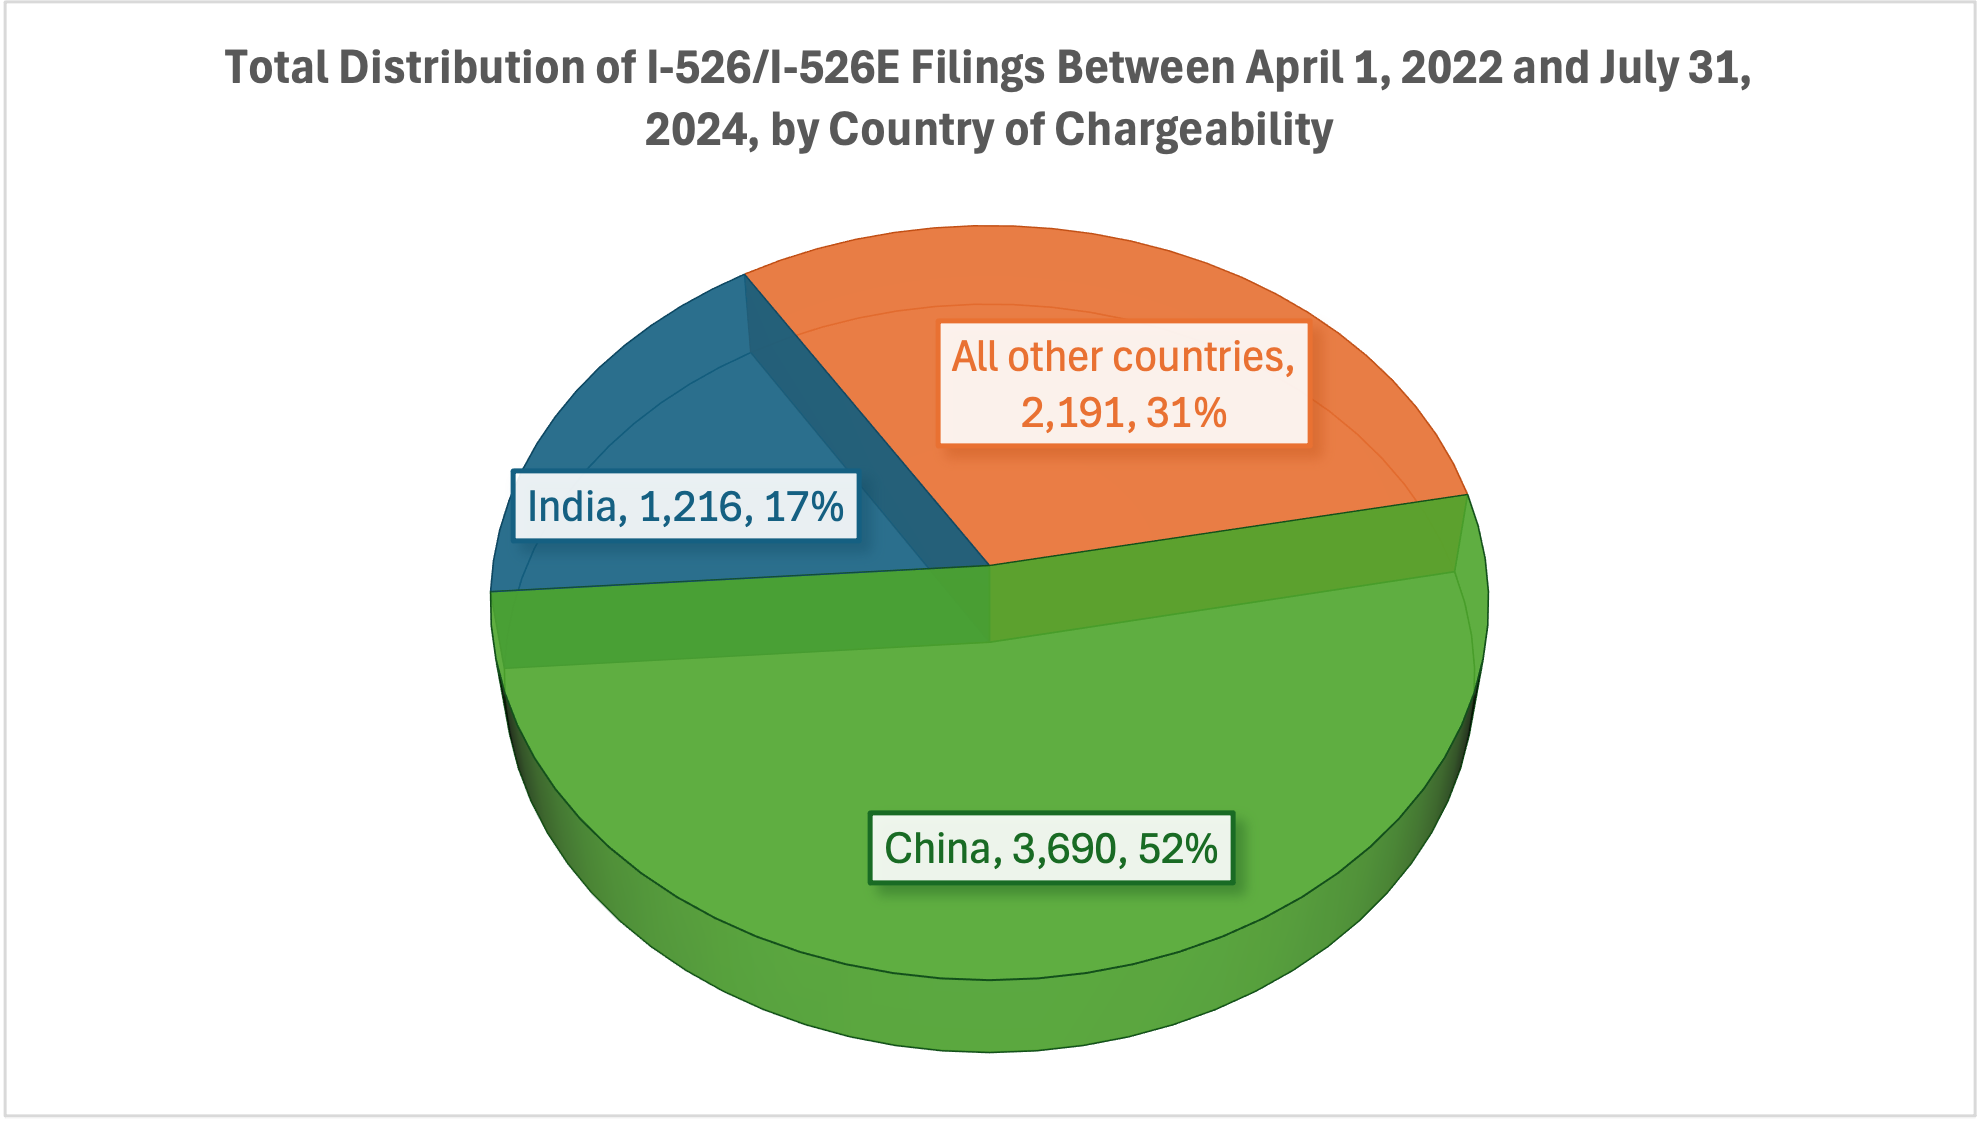
| Total | 3,690 | 1,216 | 2,191 | 7,097 | 100% |
| % Total | 52% | 17% | 31% | 100% |
The latest data provides detail on the abrupt and massive spike in petition filing during March 2024, as people rushed to file ahead of the fee increase implemented on April 1st. In the months following March 2024, the data shows – for the first time – rural TEA filings starting to exceed high unemployment filings, and petitions from “rest of the world” countries exceeding petitions from China and India.
By the end of July 2024, a total of 3,995 investors had filed I-526/I-526E in the high unemployment category, and a total of 2,809 investors had filed I-526/I-526E in the rural category. That potentially means demand for about 8,000 high unemployment visas and 5,600 rural visas (more or less, depending on family sizes and denial rates). Compare that to average annual visa availability of 1,000 high unemployment visas and 2,000 rural visas.
Demand Trend by TEA Category
Global Post-RIA I-526/I-526E Filing Trend, by Visa Set-Aside Categories
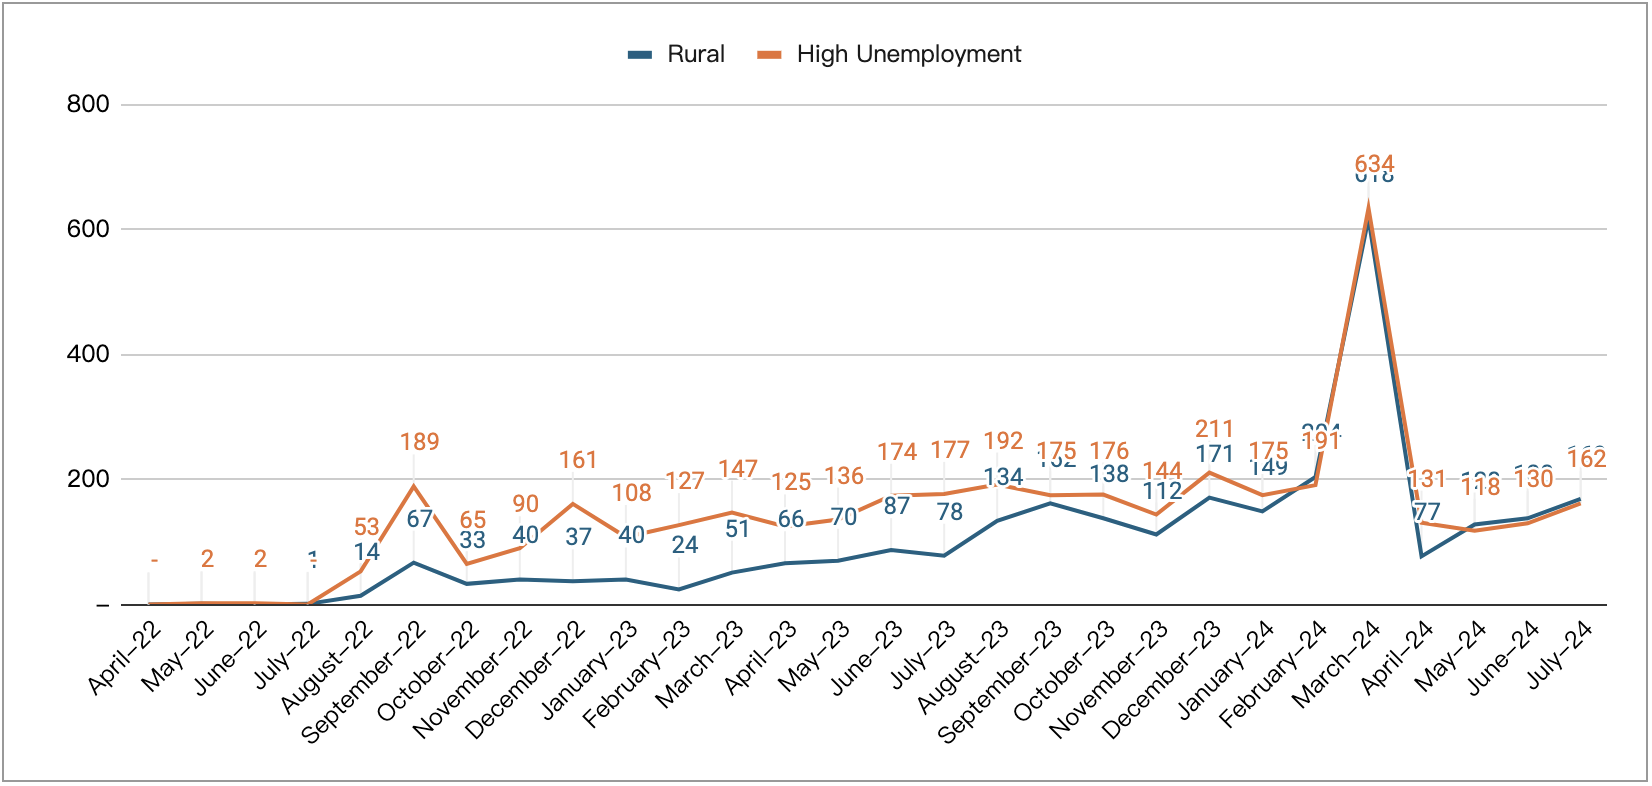 As one can tell by the chart, the demand gap between immigrants investing in Rural vs High Unemployment projects is closing.
Demand Trend by Country
Global Post-RIA I-526/I-526E Filing Trend, by Country of Changeability
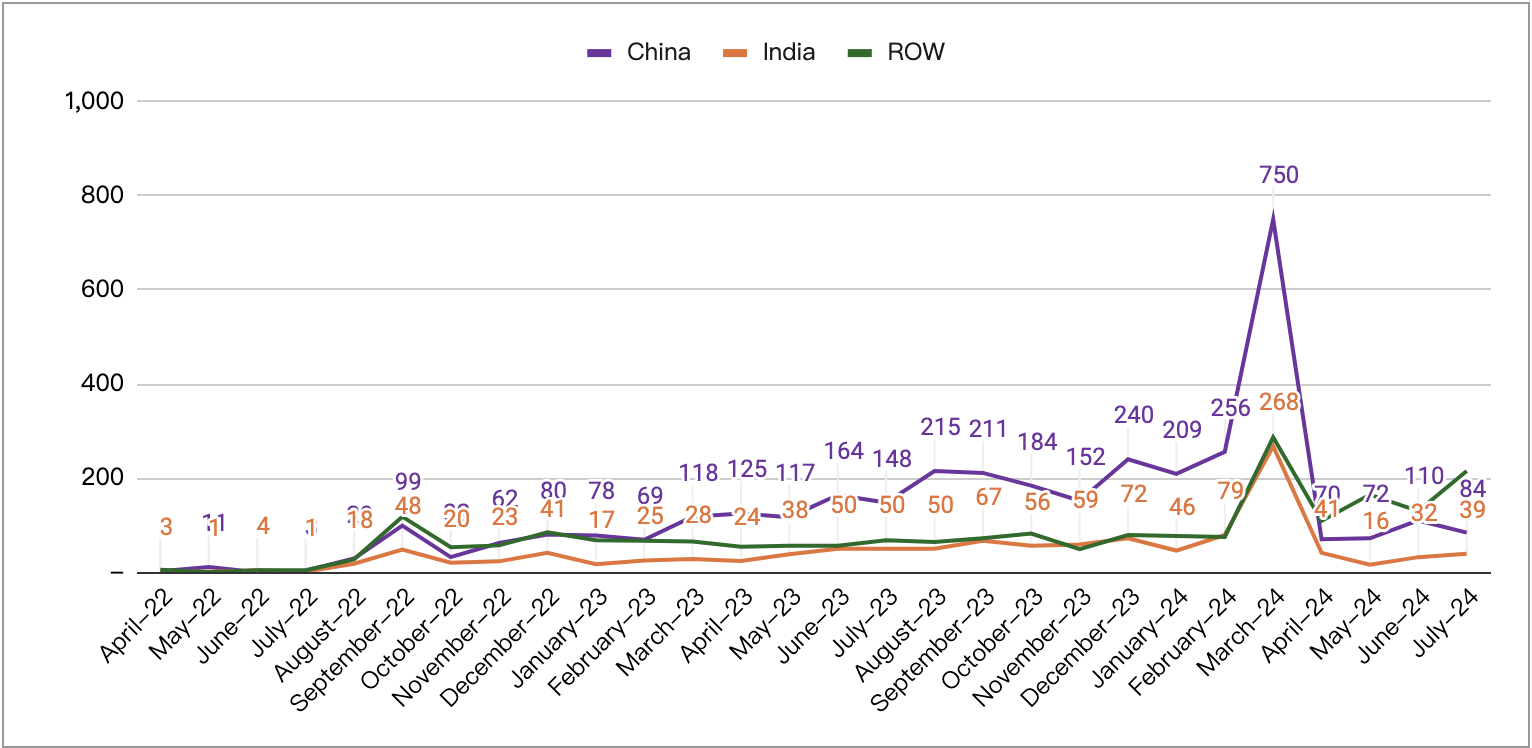
The global petition filing remained relatively steady prior to March 2024, with China filing more petitions than the rest of the world combined in most months. However, the fee increase schedule created a spike in demand during March, resulting in more than 1,000 petitions being filed in a single month, which has also caused the petition filings to drop significantly in the following months.
The following graphs denote the I-526/I-526E filing breakdowns for major EB-5 markets, including Mainland China, India, South Korea, and Taiwan. These countries have all followed the recent filing patterns illustrated above.
China Rural vs HUA
Rural vs High Unemployment I-526/I-526E Filings from Mainland China
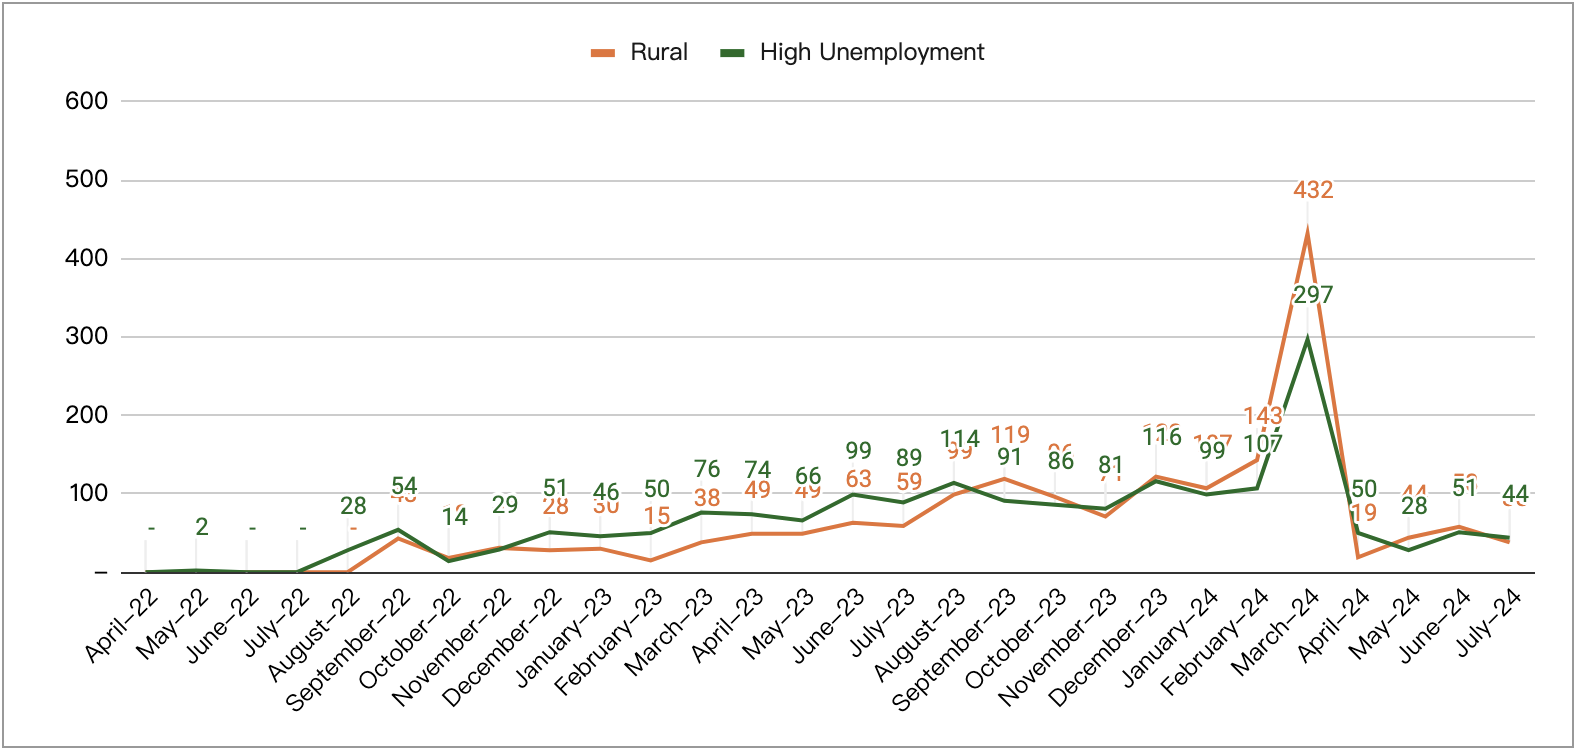 India Rural vs HUA
Rural vs High Unemployment I-526/I-526E Filings from India
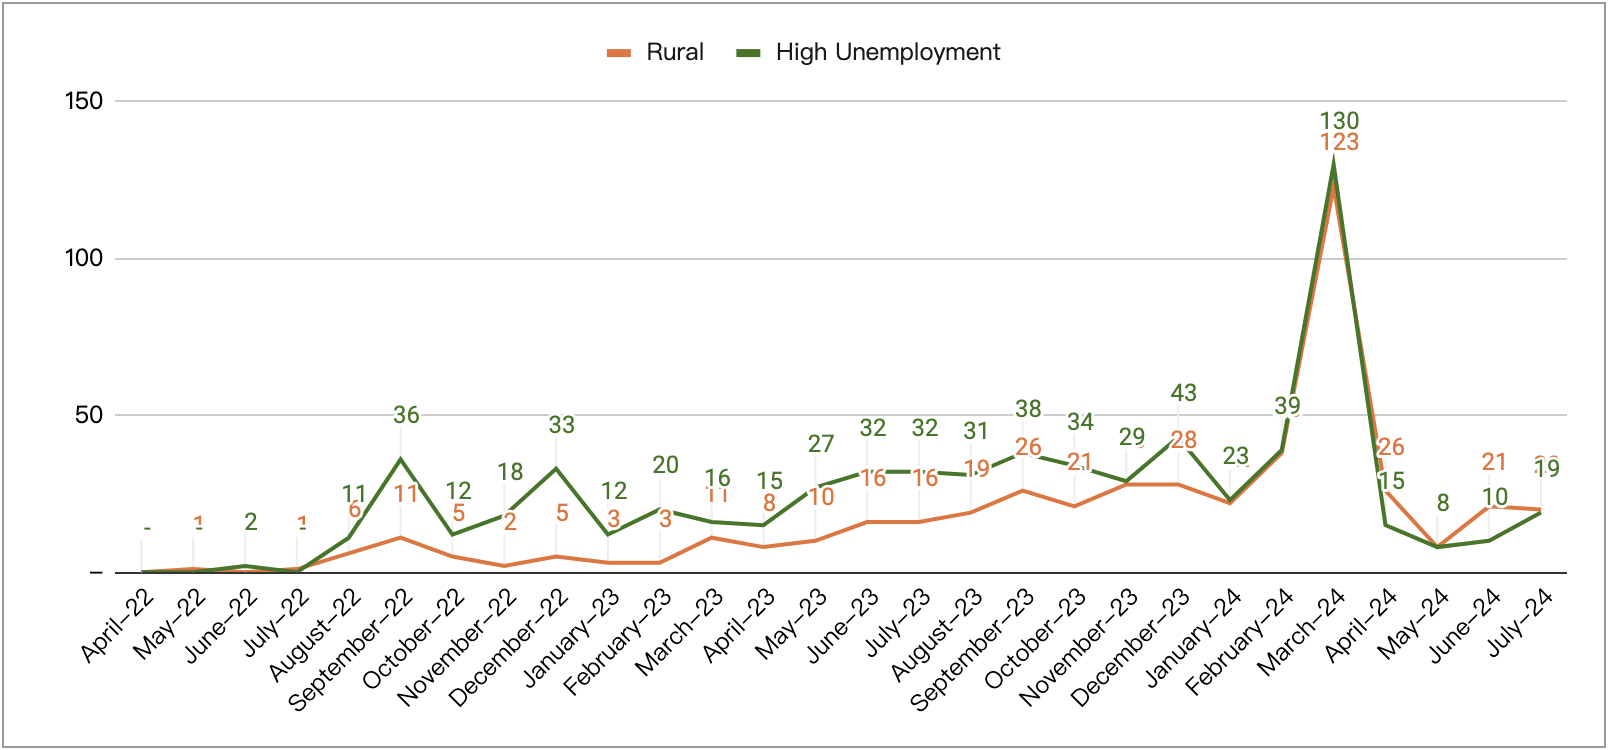 South Korea Rural vs HUA
Rural vs High Unemployment I-526/I-526E Filings from South Korea
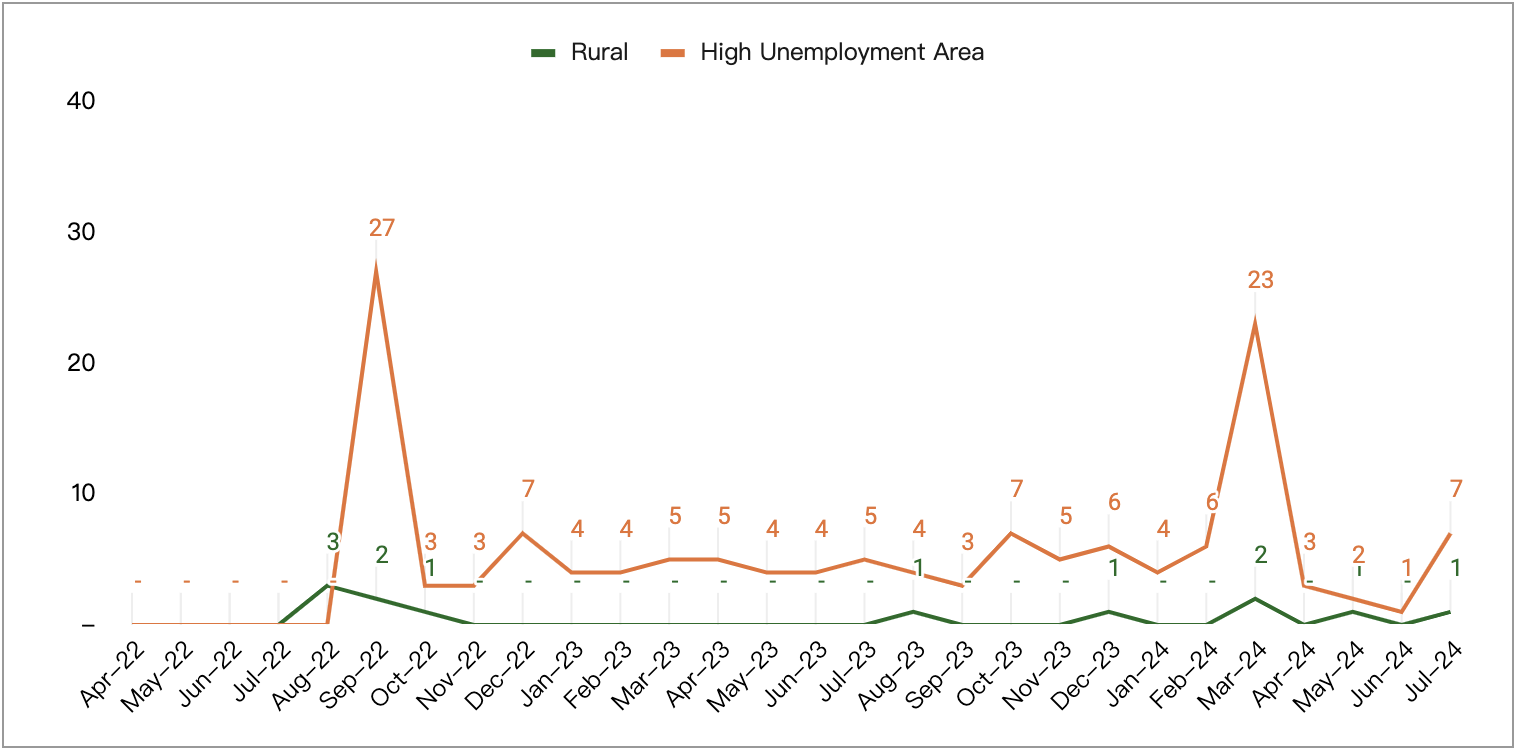 Taiwan Rural vs HUA
Rural vs High Unemployment I-526/I-526E Filings from Taiwan
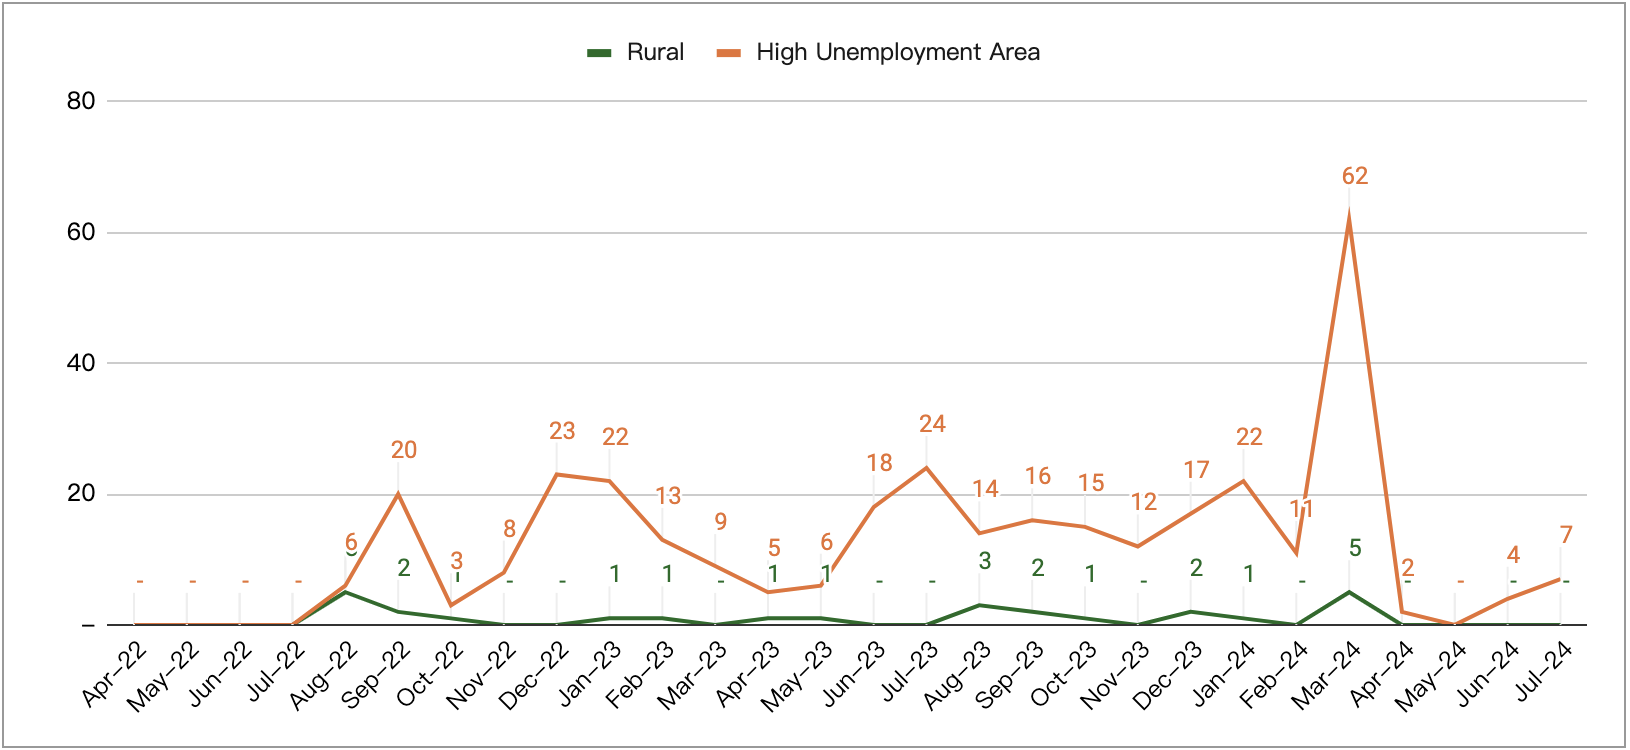 Comparison of EB-5 Demand in the Top Markets
Distribution of I-526E Filings for the Rural Category (April 2022 to July 2024)
 Distribution of I-526E Filings for the High Unemployment Category (April 2022 to July 2024)
 How long is the wait time for a visa if I invest today?
Wait times result when visa demand exceeds limited annual visa supply. Estimating specific wait times starts with facts, including how many investors have already joined the queue for visas, how many visas will be available, and how visas get allocated by country and category. Then the estimate has to add assumptions on top of the facts, including assumptions about family sizes, future denial rates, and future I-526/I-526E processing speed, volumes, and priority. People with different agendas will use different assumptions and reach different conclusions. But it is critical for every estimate to at least start from facts. As an organization, AIIA will not tell you the one and only way to interpret the data, but we want to empower you with data to interpret for yourself.
Individual wait time estimates are complex and open to difference of opinion, but the big picture is simple: demand > supply = wait times. By that metric, the high unemployment category was clearly already headed toward a significant backlog and visa wait times as of November 2023, the end of last year, while the rural category appeared to have some cushion but is approaching the backlog rapidly. Individual analysis should drill down more deeply and include the country factor. The backlog risk is especially a concern for applicants from China and India, considering that these countries have shown strong demand but are limited to 7% of available visas plus what is leftover from the rest of the world.
Final Thoughts
Investors and professionals rely on accurate data to make informed decisions regarding immigration and investment for their clients. Understanding visa processing and issuance timelines and the number of investors waiting in line is crucial in the EB-5 program, especially given the uncertainty in immigration policies. However, USCIS does not consistently provide this information, prompting AIIA to file Freedom of Information Act requests on behalf of the EB-5 community.
As a nonprofit organization, AIIA invests significant time and resources in acquiring, analyzing, and disseminating this data. We rely solely on donations to sustain our efforts, including funding FOIA litigation, lobbying, and daily operations. We urge anyone who values our work to enhance transparency in the EB-5 program to consider supporting us by making a donation or membership contribution. Your support is vital in ensuring that we can continue to advocate for transparency and equity in the EB-5 program, benefiting investors and industry professionals alike.

the number of India are not right.
Rural 478, HUA 685, Other 3, Total is 1166, is not 1216.
Thank you for pointing this out, its been fixed.
Great job, fantastic data but is there a way to open more ROW and provide info on in example Vietnam, Mexico, Nigeria, etc or at least LATAM, Africa, etc
Yes, we share the full dataset with the breakdown of the Rest of World countries with our members. You can find details of industry membership here: https://goaiia.org/membership-with-aiia/#industry
Could you also share FOIA data for pre-RIA (I-526) ?
I do not see anything for India since there is no movement from Jan, 2022 till March 15th.
Thanks